How To View Metrics
How To Read Email Blast Metrics
-
Wait at least 24 hours after you’ve sent your email to allow enough time for people to open the email.
-
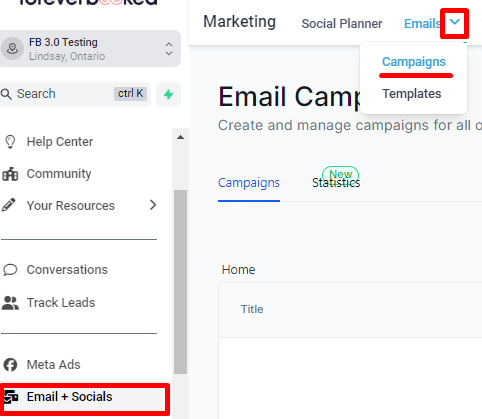
Go to “Email+Socials” → “Emails” → “Campaigns”.
-
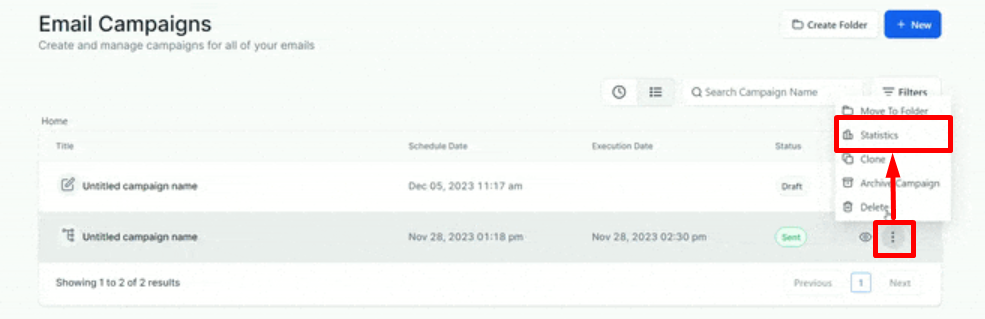
Click the three vertical dots on the right-most part of the campaign you want to see stats for, then click “Statistics.”
How To Read Email Drip Stats
- Go to “Automation” → “Workflows” → the workflow where your drip campaign is held.
- Click on the green “Email” box of the email you want to see stats for.
- Click the “Statistics” tab on the top left.
Email Stats Benchmarks
Successful Delivery: Should be 95% or higher. If it’s below 95%, send us an email and we’ll help you fix it.
Opened: 0-10%: Poor | 10-20%: Ok | 20-30%: Good | 30-50%: Great | 50%+ Amazing
Clicked: How many people clicked a link in the email? If you have an obvious link that you’re driving people to, anything above 5% is a good click rate.
Soft Bounce: The email was not delivered as the recipient’s server is unavailable or their inbox is full.
Hard Bounces: The email was not delivered as the email address was not existent or a blocked email address. Should be below 3%. If over 3%, message us and we’ll fix it.
Unsubscribed: The number of recipients who have unsubscribed from your emails by clicking the “unsubscribe” link appended in the email footer.
Note - Once the contact has unsubscribed, it will not be possible to send further emails to them. It would require a special request with acceptable reasons, as the contact will have made a diligent choice to unsubscribe.
Spam: The number of recipients who have marked your email as spam. Should be below 1%. If higher, message us and we’ll help fix it.